Bug #118042
Bug #118327: 【AF】【EVT3】【Monkey】Device#2(4+27个APK(无豌豆荚)-内部测试命令),异常终止
IOVDEV-28972 【内部】【VC1】【0095】【台架】【EE环境】【副屏】偶发一次日志收集工具界面副屏冻屏现象
| Status: | CLOSED | Start date: | 2023-05-18 | |
|---|---|---|---|---|
| Priority: | Urgent | Due date: | 2023-06-05 | |
| Assignee: | CD FW周平 | % Done: | 0% | |
| Category: | 冻屏 | |||
| Target version: | - | |||
| Need_Info: | -- | Found Version: | 01.00.0095.c103 | |
| Resolution: | DUPLICATE | Degrated: | -- | |
| Severity: | Critical | Verified Version: | ||
| Reproducibility: | Occasionally | Fixed Version: | 2023-05-26 | |
| Test Type: | Free Test | Root cause: |
Description
【环境信息】EE环境
【问题出现时间】:20230518 10点27分( 第145次开机)
【前提条件】:车机上电(KL30ON ,KL15 ON)
1.副屏在使用应用宝下载多个应用
2.进入日志收集工具界面打算开始收集实时日志
3.还未开启收集实时日志,应用宝弹窗提示安装应用,点击安装
【实际结果】
弹窗提示已安装应用,但副屏冻屏,不响应任何操作。
【期望结果】
副屏日志收集工具界面正常运行,无冻屏现象。
【备注】:
此问题出现一次,约15分钟后自行恢复。
车架号VIN:HRYTTESTVINMGM400
log地址:https://ofs.human-horizons.com/#/download/index/nPJPkglpfG8%3D
视频地址:https://ofs.human-horizons.com/#/download/index/Isroa5GAAJ4%3D
【影响版本】:副屏:01.00.0095.c103
【硬件版本号】:/
【是否能恢复】:可恢复

History
#2 Updated by CDTS-TEST 周婷 over 2 years ago
- Priority changed from Normal to Urgent
#3 Updated by CD SYSTEM-夏旭 over 2 years ago
1.安装 05-18 09:12:19.042 2792 2812 I MediaProvider: Open with lower FS for /storage/emulated/0/Download/com.tencent.android.qqdownloader_8.4.2_8422130.apk. Uid: 10028
2.启动tencent APP
ActivityTaskManager: START u0 {flg=0x10010000 cmp=com.tencent.android.qqdownloader/com.tencent.assistant.activity.SplashImplActivity (has extras)} from uid 10094
3.从上面com.tencent.android.qqdownloader.APK安装到后面的时间未发现明显异常
4. 发生时间20230518 10点27分
从log的中未发现20230518 10点27分,时间点的log,最晚的log时间在05-18 09:59:13.748 这个时间点,
只从log发现有内存低的情况,并杀了一些APP,未找到相半冻屏的信息
#4 Updated by CD System 雷祥 over 2 years ago
[当前状态]
1. 视频的时间记录为10点27,但是日志只抓到9:58,没有抓到后续的日志,查看打包日志时间没有问题,说明大概率是底层tlog服务出现问题。
2. 和上面的分析一致,在Bug_118042对应的日志里面,只看到大量的存在lowmemorykiller的情况,并杀死了一些APP来缓解内存压力,没有找到freeze的相关日志,也说明问题是在目前的日志内容后发生的。
[下一步动作]
需要分为2个方向
1. 针对当前状态下,为什么tlog没有抓取到对应日志的问题,是不是lowmemorykiller引起的,看是否能模拟low memory的情况来进行复现,看是否需要建立子票追踪。
2. 针对视频中冻屏的问题,由于没有抓取到有用信息,需要测试帮忙复现问题,最好能保留现场,并使用adb logcat -b all 再抓取日志,防止tlog出现漏抓的问题。
#5 Updated by CDTS-TEST 周婷 over 2 years ago
- File 1684832241438.zip added
- Assignee changed from CD SYSTEM-夏旭 to CD System 雷祥
如飞书log 已添加,请继续分析
#6 Updated by CD System 雷祥 over 2 years ago
[当前状态]
周婷帮忙在jira上面重新提供了日志(1684832241438.zip,密码:MGM400),从新的日志来看,和之前的日志包含的内容基本一致,仍然缺少发生问题时的日志,只是多加上了146次开机时的日志,第146次开机在11:12左右了。
[下一步动作]
已联系测试今天晚上帮忙进行复测,发生问题时需要保存问题现场。
#7 Updated by CD System 雷祥 over 2 years ago
- Status changed from New to ASSIGNED
#8 Updated by CDTS_TEST 王成 over 2 years ago
- Due date set to 2023-05-26
#9 Updated by CDTS_TEST 王成 over 2 years ago
- Fixed Version set to 2023-05-26
#10 Updated by CDTS-TEST 周婷 over 2 years ago
- Category changed from SYSTEM to 冻屏
#11 Updated by CD System 雷祥 over 2 years ago
- File Bug118042.7z added
[当前状态]
1. 原bug的日志中,缺失问题发生的日志,暂时不用处理,目前处理内部使用monkey压测时复现的冻屏问题。对应日志:Bug118042.7z
2. 复现冻屏时,可以使用getevent来获取到数据,详情可以参加touchevent.log,说明当时底层驱动仍然可以响应外部中断,但是上层APP没有任何响应,且投屏无法使用。
3. 通过日志526.txt查看,没有发现上层打印原生日志“input_focus”或者项目增强日志“ViewTouchDebug”,说明上层没有接受到event或者没有把event分发给对应的APP焦点。
4. 同时设备出现大量如下异常日志,参加526.txt.
a. Slow operation警告
05-24 02:50:28.730 1529 1647 W ActivityManager: Slow operation: 2002ms so far, now at startProcess: asking zygote to start proc
05-24 02:50:28.742 1529 1647 W ActivityManager: Slow operation: 2014ms so far, now at startProcess: returned from zygote!
05-24 02:50:28.742 1529 1647 W ActivityManager: Slow operation: 2014ms so far, now at startProcess: done updating battery stats
05-24 02:50:28.742 1529 1647 W ActivityManager: Slow operation: 2014ms so far, now at startProcess: building log message
05-24 02:50:28.742 1529 1647 W ActivityManager: Slow operation: 2015ms so far, now at startProcess: starting to update pids map
05-24 02:50:28.743 1529 1647 W ActivityManager: Slow operation: 2015ms so far, now at startProcess: done updating pids map
b. binder通信失败
05-24 04:37:56.217 0 0 I [44779.906676] binder: 675:748 transaction failed 29201/-28, size 144-0 line 3240
05-24 04:37:57.136 0 0 I [44780.825300] binder: 1529:1636 transaction failed 29201/-28, size 88-0 line 3240
05-24 04:37:59.103 0 0 I [44782.796166] binder: 1529:1636 transaction failed 29201/-28, size 88-0 line 3240
05-24 04:37:59.287 0 0 I [44782.976927] binder: 675:748 transaction failed 29201/-28, size 144-0 line 3240
05-24 05:17:28.345 1529 1636 E JavaBinder: !!! FAILED BINDER TRANSACTION !!! (parcel size = 88)
c. 在现场抓日志,发现触摸屏事件,底层有响应,同时根据如下日志,可以看到InputDispatcher也有接收到事件,但是Window窗口未正确处理触摸事件。
05-24 05:27:07.976 1529 1776 W InputDispatcher: Window 7276850 NotificationShade is not responsive
05-24 05:27:07.976 1529 1776 W InputDispatcher: 7276850 NotificationShade will not receive the new gesture at 47731630401000
05-24 05:27:07.976 1529 1776 W InputDispatcher: Unresponsive monitor edge-swipe (server) will not get the new gesture
05-24 05:27:07.976 1529 1776 W InputDispatcher: Unresponsive monitor swipe-up (server) will not get the new gesture
05-24 05:27:07.976 1529 1776 I InputDispatcher: Dropping event because there is no touchable window or gesture monitor at (64, 991) in display 0.
05-24 05:27:07.987 1529 1776 I InputDispatcher: Dropping event because there is no touched foreground window in display 0 or gesture monitor to receive it.
05-24 05:27:07.987 1529 1776 I InputDispatcher: Dropping event because there is no touched foreground window in display 0 or gesture monitor to receive it.
05-24 05:27:07.987 1529 1776 I InputDispatcher: Dropping event because there is no touched foreground window in display 0 or gesture monitor to receive it.
05-24 05:27:07.987 1529 1776 I InputDispatcher: Dropping event because there is no touched foreground window in display 0 or gesture monitor to receive it.
05-24 05:27:08.025 1529 1776 I InputDispatcher: Dropping event because there is no touched foreground window in display 0 or gesture monitor to receive it.
最主要的是c,触摸屏幕时,底层有上报数据,但是window窗口没有响应,导致冻屏现象。
[下一步动作]
需要FW这边帮忙调查为什么上层没有接收到InputDispatcher分发的event.
#12 Updated by CD FW周平 over 2 years ago
- Assignee changed from CD System 雷祥 to CDTS-TEST 周婷
从log上看是豌豆荚应用一直在尝试重启,但是因为某种原因又启动不起来,所以导致了没有一直被杀死,这个时候是没有办法响应用户的时间的。
05-24 05:27:08.131 2859 2859 D AndroidRuntime: >>>>>> START com.android.internal.os.RuntimeInit uid 2000 <<<<<<
05-24 05:27:08.165 1529 1646 W ActivityManager: Process ProcessRecord{8ea5c94 2830:com.wandoujia.phoenix2:aid/u0a118} failed to attach
05-24 05:27:08.165 1529 1646 I am_process_start_timeout: [0,2830,10118,com.wandoujia.phoenix2:aid]
05-24 05:27:08.166 1529 1646 I ActivityManager: Killing 2830:com.wandoujia.phoenix2:aid/u0a118 (adj 10000): start timeout ----》 启动超时
05-24 05:27:08.166 1529 1646 I am_kill : [0,2830,com.wandoujia.phoenix2:aid,-10000,start timeout]
05-24 05:27:08.171 1529 1646 W ActivityManager: ProcessRecord{7fa76ab 15414:com.wandoujia.phoenix2:aid/u0a118} is attached to a previous process 15414
05-24 05:27:08.184 676 676 I Zygote : Process 2830 exited due to signal 9 (Killed) -----》 进程被杀死。
Next Action:
尝试不安装豌豆荚应用,重新跑monkey。
#13 Updated by CD FW周平 over 2 years ago
删除豌豆荚的VB版本的monkey正在测试,等待测试结果。
#14 Updated by CD FW周平 over 2 years ago
VB 两次都是出现了surfaceflinger的墓碑过后,anr就停了。
1, Device2:
Cmdline: /system/bin/surfaceflinger
pid: 912, tid: 1705, name: Binder:912_3 >>> /system/bin/surfaceflinger <<<
uid: 1000
signal 6 (SIGABRT), code 1 (SI_QUEUE), fault addr -------
2, Device3:
Cmdline: /system/bin/surfaceflinger
pid: 997, tid: 1670, name: Binder:997_3 >>> /system/bin/surfaceflinger <<<
uid: 1000
signal 6 (SIGABRT), code 1 (SI_QUEUE), fault addr -------
从墓碑来看,原因都是一样,都是libdolphin.so 出问题了:
backtrace:
#00 pc 0000000000051988 /apex/com.android.runtime/lib64/bionic/libc.so (abort+168) (BuildId: 369edc656806aeaf384cbeb8f7a347af)
#01 pc 000000000004165c /apex/com.android.runtime/lib64/bionic/libc.so (scudo::die()+12) (BuildId: 369edc656806aeaf384cbeb8f7a347af)
#02 pc 0000000000041d74 /apex/com.android.runtime/lib64/bionic/libc.so (scudo::ScopedErrorReport::~ScopedErrorReport()+36) (BuildId: 369edc656806aeaf384cbeb8f7a347af)
#03 pc 0000000000041fc8 /apex/com.android.runtime/lib64/bionic/libc.so (scudo::reportInvalidChunkState(scudo::AllocatorAction, void*)+80) (BuildId: 369edc656806aeaf384cbeb8f7a347af)
#04 pc 0000000000043664 /apex/com.android.runtime/lib64/bionic/libc.so (scudo::Allocator<scudo::AndroidConfig, &(scudo_malloc_postinit)>::deallocate(void*, scudo::Chunk::Origin, unsigned long, unsigned long)+316) (BuildId: 369edc656806aeaf384cbeb8f7a347af)
#05 pc 000000000000aaf4 /system_ext/lib64/libdolphin.so (android::updateLayerListLocked(std::__1::basic_string<char, std::__1::char_traits<char>, std::__1::allocator<char> > const&, bool) (.cfi)+372) (BuildId: a2bd01334f3682675a19bcb37cfc7c99)
#06 pc 000000000000b3e4 /system_ext/lib64/libdolphin.so (dolphinTrackBufferIncrement.cfi+436) (BuildId: a2bd01334f3682675a19bcb37cfc7c99)
#07 pc 00000000001c05b8 /system/bin/surfaceflinger (ZNSt3_110__function6__funcIZN7android14SurfaceFlinger19setTransactionStateERKNS2_17FrameTimelineInfoERKNS2_6VectorINS2_13ComposerStateEEERKNS7_INS2_12DisplayStateEEEjRKNS2_2spINS2_7IBinderEEERKNS2_19InputWindowCommandsElbRKNS2_14client_cache_tEbRKNS_6vectorINS2_17ListenerCallbacksENS_9allocatorISS_EEEEmE4$_65NST_ISY_EEFvRKNS2_13layer_state_tEEEclES12_$8fd14edc326db0e9be510f46fb0c4dd5+688) (BuildId: 8958ca1cdc030c3e3967c8ecef82dddb)
#08 pc 00000000001a0ce0 /system/bin/surfaceflinger (android::SurfaceFlinger::setTransactionState(android::FrameTimelineInfo const&, android::Vector<android::ComposerState> const&, android::Vector<android::DisplayState> const&, unsigned int, android::sp<android::IBinder> const&, android::InputWindowCommands const&, long, bool, android::client_cache_t const&, bool, std::__1::vector<android::ListenerCallbacks, std::__1::allocator<android::ListenerCallbacks> > const&, unsigned long)+1724) (BuildId: 8958ca1cdc030c3e3967c8ecef82dddb)
#09 pc 00000000000c44d8 /system/lib64/libgui.so (android::BnSurfaceComposer::onTransact(unsigned int, android::Parcel const&, android::Parcel*, unsigned int)+13700) (BuildId: 448b4199bacacf9417cd93df4f7390f5)
#10 pc 00000000001aa468 /system/bin/surfaceflinger (android::SurfaceFlinger::onTransact(unsigned int, android::Parcel const&, android::Parcel*, unsigned int)+852) (BuildId: 8958ca1cdc030c3e3967c8ecef82dddb)
#11 pc 0000000000049880 /system/lib64/libbinder.so (android::BBinder::transact(unsigned int, android::Parcel const&, android::Parcel*, unsigned int)+252) (BuildId: 07bc4d4147790b1e0ac44f7625168f4a)
#12 pc 00000000000538cc /system/lib64/libbinder.so (android::IPCThreadState::executeCommand(int)+1048) (BuildId: 07bc4d4147790b1e0ac44f7625168f4a)
#13 pc 00000000000533e8 /system/lib64/libbinder.so (android::IPCThreadState::getAndExecuteCommand()+164) (BuildId: 07bc4d4147790b1e0ac44f7625168f4a)
#14 pc 0000000000053c98 /system/lib64/libbinder.so (android::IPCThreadState::joinThreadPool(bool)+72) (BuildId: 07bc4d4147790b1e0ac44f7625168f4a)
#15 pc 0000000000080484 /system/lib64/libbinder.so (android::PoolThread::threadLoop()+28) (BuildId: 07bc4d4147790b1e0ac44f7625168f4a)
#16 pc 000000000001358c /system/lib64/libutils.so (android::Thread::_threadLoop(void*)+264) (BuildId: b940f836006eead456c936e97e64d2d4)
#17 pc 0000000000012de8 /system/lib64/libutils.so (thread_data_t::trampoline(thread_data_t const*)+408) (BuildId: b940f836006eead456c936e97e64d2d4)
#18 pc 00000000000b6a24 /apex/com.android.runtime/lib64/bionic/libc.so (_pthread_start(void*)+264) (BuildId: 369edc656806aeaf384cbeb8f7a347af)
#19 pc 00000000000532bc /apex/com.android.runtime/lib64/bionic/libc.so (_start_thread+68) (BuildId: 369edc656806aeaf384cbeb8f7a347af)
Next Action:
已经给qcom 提了case(06648370),等待qcom回复。
#15 Updated by CDTS-TEST 周婷 over 2 years ago
- Parent task set to #118333
#16 Updated by CDTS-TEST 周婷 over 2 years ago
- Parent task changed from #118333 to #118327
#17 Updated by CDTS-TEST 周婷 over 2 years ago
- Assignee changed from CDTS-TEST 周婷 to CD FW周平
请跟进高通case 情况
#18 Updated by CDTS-TEST 周婷 over 2 years ago
- Due date changed from 2023-05-26 to 2023-06-05
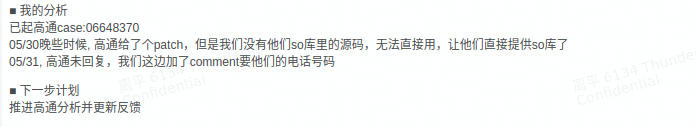
#19 Updated by CD FW周平 over 2 years ago
- File qcom.png added
#20 Updated by CD FW周平 over 2 years ago
依然在等qcom回复,请查看附件图片
#21 Updated by CD FW周平 over 2 years ago
QCOM 让重新期票给 performance team:
Hi Customer,
Can you always see the below error logs when the issue occurs
---
05-28 22:36:23.106 20578 20578 F DEBUG : #05 pc 000000000000aaf4 /system_ext/lib64/libdolphin.so (android::updateLayerListLocked(std::__1::basic_string<char, std::__1::char_traits<char>, std::__1::allocator<char> > const&, bool) (.cfi)+372) (BuildId: a2bd01334f3682675a19bcb37cfc7c99)
05-28 22:36:23.106 20578 20578 F DEBUG : #06 pc 000000000000b3e4 /system_ext/lib64/libdolphin.so (dolphinTrackBufferIncrement.cfi+436) (BuildId: a2bd01334f3682675a19bcb37cfc7c99)
---
If yes, please create new case for performance team to check because libdolphin belongs to our performance team
#22 Updated by CDTS-TEST 周婷 over 2 years ago
- Status changed from ASSIGNED to RESOLVED
- Resolution changed from -- to DUPLICATE
高通case 同118327 跟踪
#23 Updated by CD TEST-方永红 over 2 years ago
- Status changed from RESOLVED to VERIFIED
#24 Updated by CD TEST-方永红 over 2 years ago
- Status changed from VERIFIED to CLOSED